Using After Effects CC 2018, Excel and JSON to create Graphs
Completing chart animation
Daniel Walter Scott || VIDEO: 4 of 4
So let's copy that, let's twirl that up and we're going to have to turn off 'Peaking', and we can see all the months now. so we're going to go through, click on 'February'. And you can twirl this down, and find 'Transform', 'Position'. Shortcut, if you don't know, just click on 'February, hit 'P' it will bring up just Position. Cool, I'll do the first one with us and then we'll speed it up, and you can do the other ones on your own.
So I'm going to hold down 'Option' on my Mac, 'Alt' on a PC, delete what's in there, paste it. And we're going to have to-- I'm using my arrow key just to go to the top there and find-- that's the second line, Dan, we're still in January, so this is going to be February. Hopefully now, when we click off, it goes to the right measurement. Let's have a look, it should be something under 5, yes, 4.4. I'm going to go through now, and try do this now all in one big go. So I'm going to go ahead now, copy and paste, and change them all. So, time for speed.
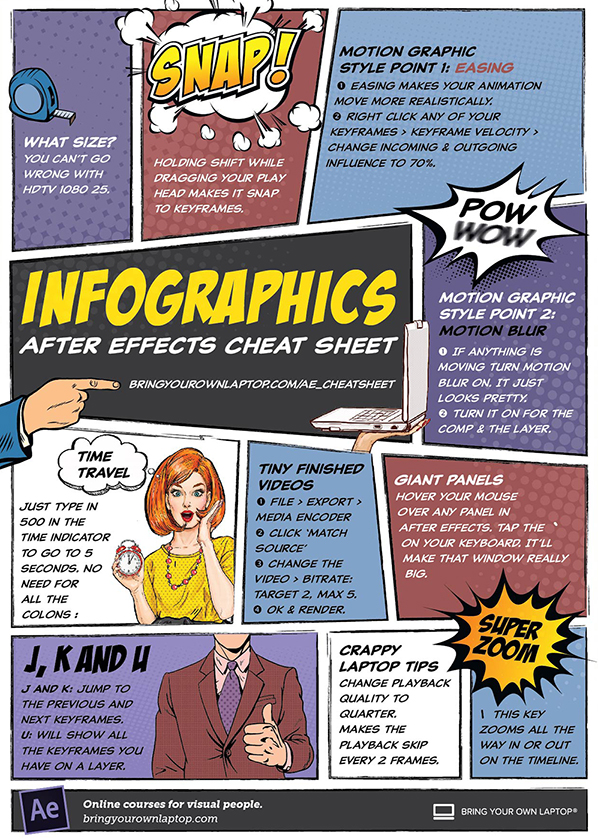
All right, we're back. And yes, by the looks of it, they're all in there. You can see, some are in the middle here, only 15°. And here is the Year stuff. It's just kind of lumped in there now, which is cool. There's my old-- whatever you need, but let's animate this, just add a little bit of simple animation. To do that, what we'll do is we'll turn on Peaking again, so I can see my line. Under Line here, we're going to use this one here that says Add. So 'Line', just where it says 'Contents' click on 'Add', there's one called 'Trim Paths'. Trim Paths is-- if I twirl that down you can use 'End'. So make sure your cursor or your Playhead is at the beginning here. Can you see, you can drag it left and right between 100%. You can kind of see it animating there on the screen. So, I'm going to slide it at 0, and I'm going to start this off, and after some time, maybe after a second and a bit, we'll stick it to 100%. So turn the stopwatch on at the beginning there, set it to 0. And now, I'll move my Playhead up, set it to 100%, and hopefully should animate between the two. Look at that sexy line.
Couple of things I want to do, just to make it look a little nicer is I'm going to select both of these guys, right click one of them, go to 'Keyframe Velocity', and here I'll set it to '75' on both sides. And I have a bit of easing going on now. Watch that. Just a bit of a nicer movement in the middle there. Up to you, you might turn Motion Blur on as well. Now at the top here, turn Motion Blur on for the Project and then on for the Layer. It might look a little nicer again, it might take a little longer to preview. It is taking a little while to render, give it a second. Hopefully now, it will loop. Ready? Ah, we're awesome.
Okay my friends, so that is how to connect a spreadsheet to After Effects. Now why is this so magic? It's magic because, up here, where I got my JSON file I can right click it, and I can go to 'Replace Footage' click 'File', find some other data like our Auckland weather and hey presto! Look at that. All updated. I'll turn Motion Blur off so it renders a bit faster for you. But super quick, super easy. So if you are doing repetitive charts, you've been stuck with that job of showing profits and losses, sales and quarterly stuff, and you want to jazz it up using After Effects, we can, really quickly and easily, once you've got that kind of Baseline set up, use JSON to pull in the data, and super easy to replace it.
So that should get you going if you already know a little bit of After Effects. If you want to know how to do Bar Charts, Pie Charts and all those other types of things, I've got a course specifically on this at bringyourownlaptop.com So go check that out, sign up if you're keen. There's a ton of other courses there. I'm Daniel Scott, haere rā. Like, subscribe to my channel if you enjoy it. And I'll see you later, I'm waving. You never can see me waving, but that's all right, I wave any way. Bye!
-
Contact Us - Group memberships
- Bio
- FAQ
- All Courses
- Resources
- Powered by instructorHQ v4
- Terms of use Privacy policy
- © Bring your Own Laptop Ltd 2024

